The headline deterioration in NNPC Limited’s July accounts is stark: profit after tax fell to ₦279 billion from ₦535 billion in June. Yet the more consequential story is not the 48% decline itself. It is the widening gap between the company’s operational dashboard and its commercial outcome.
NNPC said crude oil and condensate production averaged 1.68 million barrels per day in July, only 2.3% below June’s 1.72 million. Crude and condensate sales, however, fell 20.2% to 22.53 million barrels. Revenue dropped 29.7% to ₦3.087 trillion, while profit fell 47.9%. At the same time, NNPC reported upstream pipeline availability of 100% for a second consecutive month.
Most Nigerian coverage has treated these figures as a familiar production-disruption story. That is only partly supported by the numbers. Facility outages, equipment unavailability, pipeline incidents and constraints at several assets can explain weaker output. They do not, by themselves, explain why sales, revenue and profit deteriorated many times faster than average daily production.
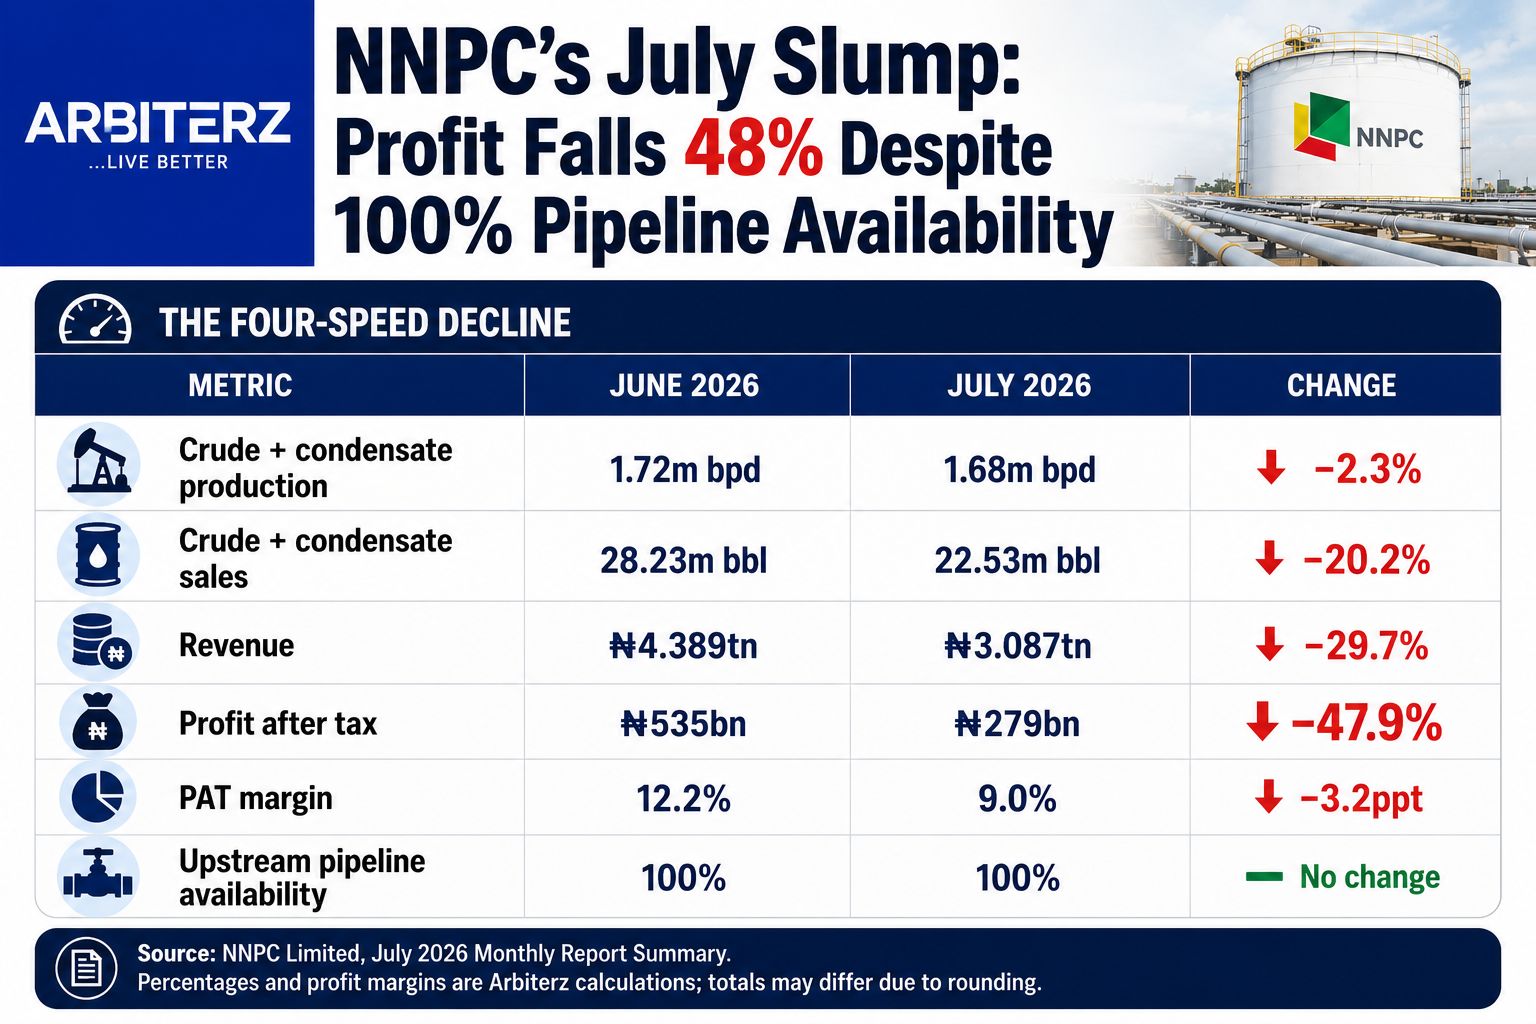
That sequence matters. It suggests a commercial conversion problem between production and profit: fewer barrels were sold, the revenue realised per unit of reported activity weakened, and profitability compressed further.
Sales Not Production is the First Missing Bridge
A production figure is not a sales figure. Barrels produced in one month may be lifted later; sales can move with cargo schedules, entitlement and equity shares, inventory movements, export-terminal constraints, customer nominations and the timing of revenue recognition. NNPC’s monthly summary does not provide the bridge needed to determine which of those factors drove July.
The distinction is especially important because the disclosed measures may not cover identical scopes. The production number can include output beyond the barrels economically attributable to NNPC, while the sales number may reflect liftings or equity volumes. Without definitions and a reconciliation, comparing them does not prove that inventories accumulated. It does prove that the dashboard is insufficient to explain the company’s commercial performance.
NNPC itself points toward bottlenecks beyond field production. Its July action plan included export optimisation at First E&P’s operations and the Nembe export point, tandem offloading at Akpo and Erha, and barging at Obodo. These are clues that evacuation and lifting logistics—not simply whether a pipeline was technically available—deserve closer scrutiny.
Why 100% Pipeline Availability is not 100% Throughput
Pipeline availability is an engineering reliability measure. It generally indicates that a system was capable of service; it does not mean every connected field, flow station, terminal, metering system or export programme operated without constraint. A pipeline can be available while upstream equipment is down, a terminal is restricted, a cargo is delayed or an asset produces below capacity.
This is the crucial nuance missing from the easy contradiction in the headline. NNPC’s 100% figure is useful, but it is not a measure of utilisation, throughput, evacuation efficiency or the proportion of produced barrels ultimately sold. Publishing availability without those companion metrics can make an operational success look more commercially conclusive than it is.
Profit Margin Contains a Second Clue
NNPC’s profit-after-tax margin fell to about 9.0% in July from 12.2% in June. That means the profit decline was not only a function of lower revenue; each naira of revenue also yielded less profit.
A simple mechanical decomposition illustrates the point. If July had maintained June’s profit margin, its reported revenue would have produced roughly ₦376 billion in profit, not ₦279 billion. Of the ₦256 billion month-on-month profit decline, about ₦159 billion is mathematically associated with lower revenue and roughly ₦97 billion with the weaker margin. This is not an accounting attribution. It is a signal that costs, pricing, product mix, foreign-exchange effects, financing charges, taxes or revenue-recognition timing require explanation.
The report does not disclose realised crude prices, operating expenses, financing costs, foreign-exchange gains or losses, or a segment-level profit bridge. It therefore cannot show whether July was a one-off timing event or evidence of a more persistent deterioration in commercial efficiency.
Do Not Equate ‘Statutory Payments’ With a Cash Remittance Schedule
NNPC reported cumulative statutory payments of ₦7.913 trillion for January to July, up from ₦6.286 trillion at the end of June. The difference is ₦1.627 trillion, but that is an Arbiterz subtraction—not a separately disclosed July remittance line.
Some reports have described the cumulative figure as money remitted to the Federation Account. NNPC’s summary uses the broader term ‘statutory payments’ and does not provide recipients, components, payment dates or a cash reconciliation. Until the underlying schedule is published, the two descriptions should not be treated as interchangeable.
The Governance Question: Can Investors Follow a Barrel Into Cash?
NNPC now publishes a welcome monthly scorecard, but a commercially run national oil company should allow readers to follow a barrel through a coherent chain: gross production, NNPC entitlement, liftings, sales volumes, realised price, revenue, cash collection, operating cost, financing cost, tax and transfer to government.
July shows why that chain matters. The company can report full pipeline availability and still suffer a severe earnings contraction because the metrics sit in separate boxes. For creditors, prospective investors, the Federation and citizens, the unanswered question is not whether a pipeline existed. It is where the value leaked between the wellhead and the income statement.
Questions NNPC Should Answer
What were NNPC’s gross, equity and entitlement production volumes in June and July, and how do they reconcile with sales?
How many barrels were lifted, invoiced and paid for in July, and what inventory or timing movements occurred?
What realised crude and condensate price did NNPC receive, by grade and market, in each month?
What were July operating expenses, financing costs, taxes and foreign-exchange gains or losses?
How is upstream pipeline availability defined, and what were utilisation, throughput and unplanned-downtime rates?

What exactly is included in ‘statutory payments’, which entities received the money, and when was cash transferred?
The strongest reading of July is therefore not that pipelines failed, nor that production alone sank profit. It is that NNPC’s published measures do not yet reconcile engineering performance with commercial results. The next stage of transparency is not another headline metric. It is the bridge that shows how barrels become cash—and where they do not.